MongoDB Atlas® Invoice Analysis
Overview
MongoDB Atlas is a widely-used NoSQL Database-as-a-Service (DBaaS) offered by MongoDB, Inc. and is accessible through major cloud providers. Atlas simplifies numerous administrative tasks like provisioning, patching, monitoring, and backups, enabling developers to concentrate on building applications.
The MongoDB Atlas Admin API exposes a set of interfaces for interacting with MongoDB Atlas deployments, independent of the underlying application data. These APIs allow for administrative tasks such as managing clusters, users, and databases. For Qarbine, the API is leveraged to gather information about these Atlas elements. Qarbine reports can consolidate and analyze data that normally appears across multiple pages in the Atlas console. Such navigation can be very time consuming.
Information such as users and roles can be merged and also graphically displayed by Qarbine. See the Qarbine catalog for many Atlas API examples. Additionally, the MongoDB Atlas API includes endpoints to retrieve invoice information that Qarbine can then analyze and format.
Access to the MongoDB Atlas API data is governed by the Atlas API token. The Qarbine Administrator oversees who can utilize each data service, ensuring secure and controlled access. The MongoDB Atlas API configuration is covered in the Administration Tool area.
Sample Invoice Report
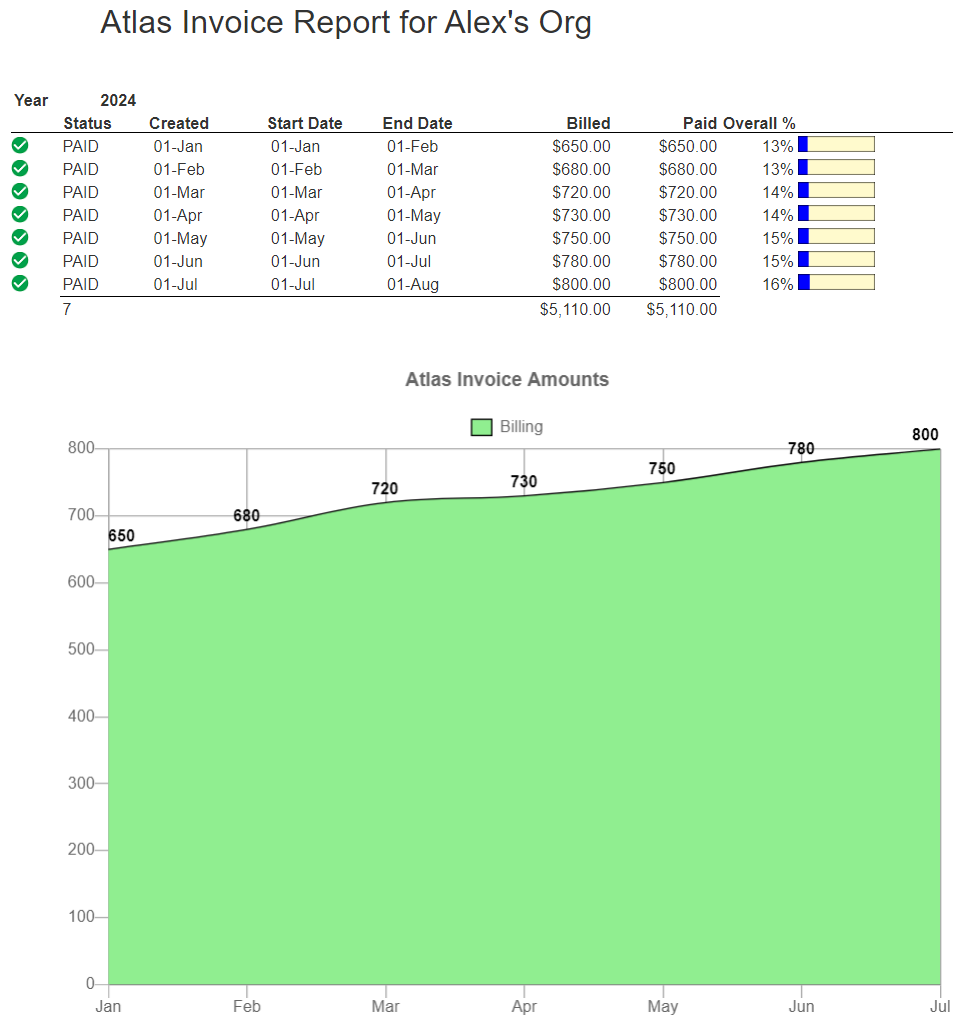
Below is a sample invoice report with both the details and an area chart. For tutorial purposes this example template uses the example MongoDB Atlas invoice data via the referenced data source. You can adjust to use your actual Atlas invoice data. The criteria is for PAID invoices in 2024.
The template can be found in the catalog at “example/MongoDB/Atlas API/Atlas invoices for org in 2024”. Adjust the main data retrieval to use sample documents via “example/MongoDB/Atlas API/Atlas invoices with sample data in 2024” or your documents by using the “example/MongoDB/Atlas API/Atlas invoices for org in 2024 using SQL”.
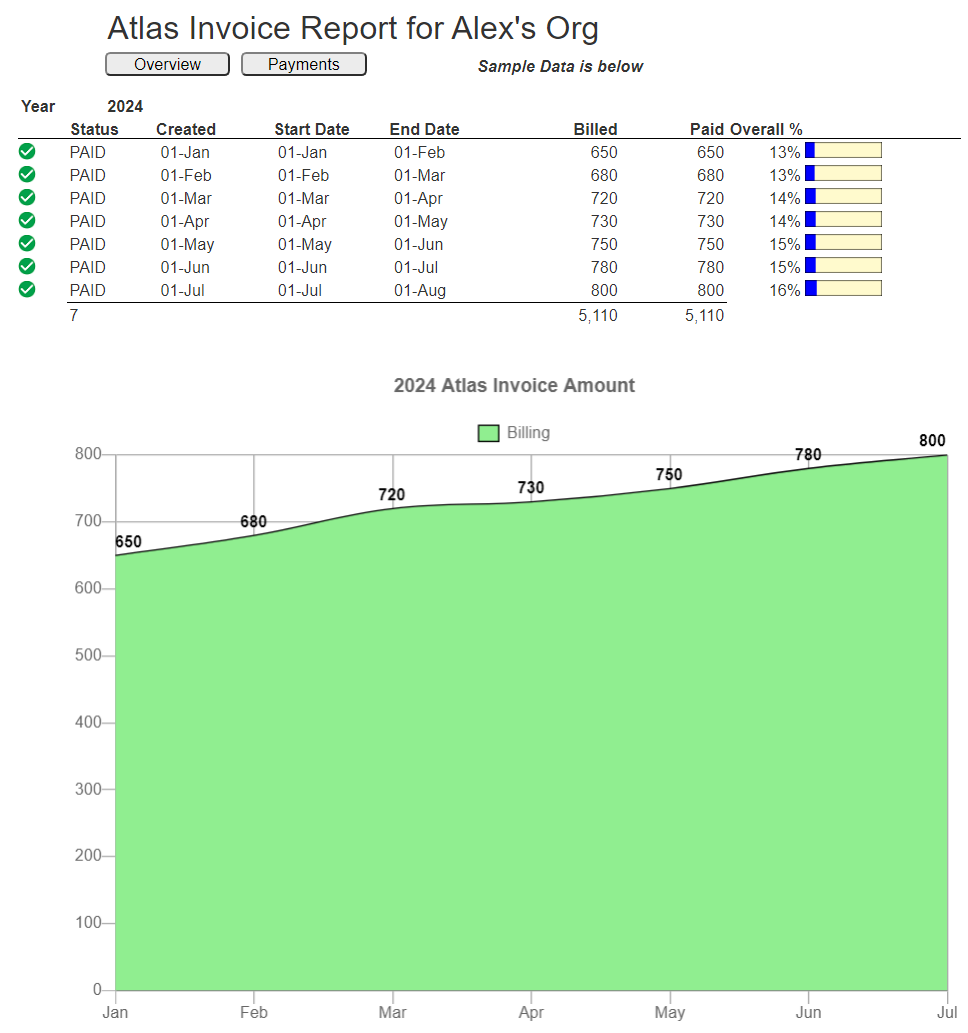
Besides the line item details the report includes visual feedback on the overall percentage that each month was within the year along with Excel-like sums for the billed and paid amounts. This report can be exported into various popular file formats or be propagated along in a headless fashion within a data processing pipeline. The underlying invoice documents can be retrieved using either MongoDB Query Language (MQL) and SQL syntax queries.
The example references the data source “example/MongoDB/Atlas API/Atlas invoices with sample data in 2024”. Its query specification is
db.mongoDbAtlasApiInvoices
.find( {statusName: "PAID",
created: {$gte : ISODate("2024-01-01") , $lte: ISODate("2024-12-31") } } )
.sort( {created: 1} )
The equivalent SQL is
select * from [! @org.id !].invoices
where startDate >= Date("2024-Jan-01") and startDate <= Date("2024-Dec-31")
and status = 'PAID'
order by startDate
Defining a Data Source
Overview
MongoDB Atlas provides an API to interact with many of the configuration and operational aspects of Atlas. The Atlas Admin API data model has many objects including past invoices and pending invoices which can be queried using Qarbine.
Querying Language
MongoDB Atlas provides an API to interact with many of the configuration and operational aspects of Atlas. Qarbine provides a MongoDB Query Language (MQL) and a SQL interface to query this data. Your familiar query skills can be applied to retrieve and present Atlas configuration and operational information.
Initial Component Setup
Open a new Data Source Designer tool via:
- Home page,
- Signing on and choosing Data Source Designer front he drop down, or
- The hamburger menu option on any tool.
If you already have a Data Source Designer tool open the start a new component by clicking
The example below uses a specific data service rather than the dynamic one “Atlas Virtual DB @orgName”.
The Qarbine Administrator defines a Qarbine Data Service to access a MongoDB Atlas instance using the Atlas API. The name of the Data Service will be selectable by you if so desired by the administrator.

Next select a “database” from the dropdown.

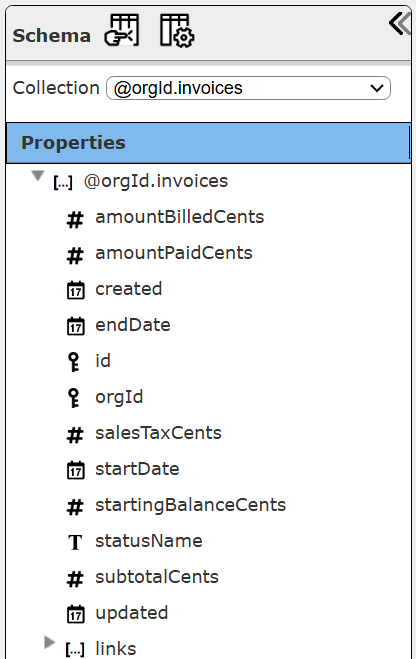
The collections drop down is populated and an invoice related collection can be chosen to see its general structure.
Setting the Organization Prompt
There are several prebuilt prompt components for use by MongoDB Atlas Admin API components. In this case we want to use one that provides a MongoDB Atlas organization object. To reference this prompt click the highlighted button shown below.
Activate the Prompt tab.

Choose the drop down option shown below.

Click the “Choose from catalog” button.
Navigate to the folder shown.
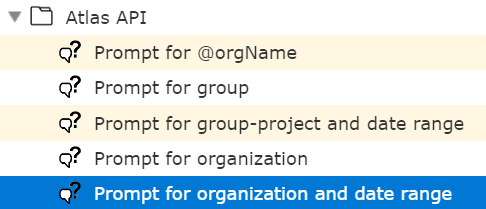
There are several predefined prompts. For this example choose the one highlighted below.
Click
The prompt reference is filled in.

Close the properties dialog by clicking
As background, when this prompt is run it presents the following dialog.
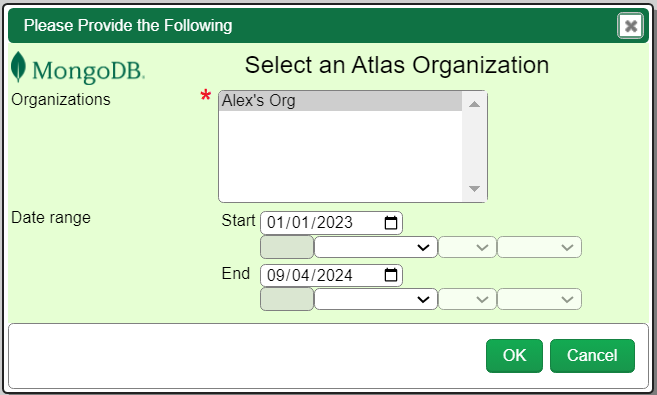
The prompt has these elements defined.

When the dialog’s “OK” button is clicked the “org” value is set to the chosen Atlas organizational object. The “Date range” widget is defined with the destination variable name of “date”. This actually acts as a prefix because the variables that get set for a “date range” widget in this case are “dateStart” and “dateEnd” for the starting and ending dates respectively.
Managing Answer Set Size
The default maximum number of rows starts off at 25 for a new data source. This is useful to evolve a query from a concept to one that you have verified returns the desired answer set. As noted, any native way of limiting an answer set size is the preferred approach. This setting is in the component dialog as shown below and also accessible by clicking the ‘Gear’ icon.

Once you are done drafting you can adjust this parameter. A “0” indicates there is no maximum. A number greater than 0 indicates to limit the final answer set size to that number of rows. This answer set truncation comes after any native query limit. So, if the answer set from the data endpoint is quite large, that content has to be returned to the Qarbine host. It then may truncate the number of rows. It is best to truncate at the query level (i.e., use a limit) to reduce the content sent from the data endpoint to the Qarbine host in the first place.
Running the Query
For reference this data source example is in the catalog as “example/MongoDB/Atlas API/Atlas invoices for org with date range”.
As a query specification enter the following MQL
db.[! @org.id !].invoices
.find( {status: "PAID", created: {$gte : @dateStart , $lte: @dateEnd } } )
.sort( {created: 1} )
The equivalent SQL is
select * from [! @org.id !].invoices
where status = 'PAID'
and startDate >= Date(@dateStart) and startDate <= Date(@dateEnd)
order by startDate
The dateStart and dateEnd variable OBJECTS are set by the prompt component. For MQL they are automatically converted into ISODate(...) calls within the final query. The SQL version of the query uses the “Date(aString)” function to achieve a similar goal.
To run this query click
The referenced prompt runs to obtain an organization object and a date range.
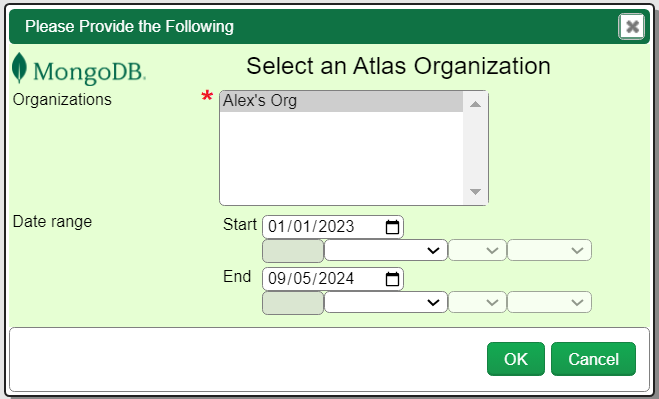
Select the organization and specify the date range. For this discussion the starting date is January 1st, 2023.
Click
The prompt sets the variable “orgName” to the selected organizational object. This object has a name and an id field. The object’s id value is inserted into the query using the block notation “[! … !]” to form the final query to be run.
In addition the variable dateStart and dateEnd are set. These are from the prompt’s date range widget which has a variable name set to ‘date’. That name is a prefix used to populate the final variables of ‘dateStart’ and ‘dateEnd’.
If there is an Atlas API token permission error this may be shown. Consult your Qarbine administrator to cross reference the data service and its configured Atlas API token permissions.
Sample results include the following subset of rows.

Adjusting the Maximum Rows
Recall the default maximum rows at the component level is 25. At this point you can change that setting by clicking.
Adjust the setting to “0” indicating no Qarbine answer set truncation.
Click
Adjusting the Displayed Dates
The standard timestamps in MongoDB Atlas are all GMT based. For a user in New York City, running the query specification with the default options shows dates such as the following.
Notice the dates are shown relative to the user’s local time. This particular invoice was created 31-Dec-2022 at about 9:00 PM relative to New York City. That is January 1st at about 2 AM GMT. To show the GMT formatted dates click
An options dialog appears.
Check the option shown.
Click
Run the query again. The first few rows of the updated results are shown below with the GMT base timestamp output.
The underlying dates are the same, they are just being presented differently. That makes a difference when authoring invoice reports that are displaying portions of these dates such as the month or year. For example, consider an analysis for invoices in a particular year.
Saving Your Component
To save your data source click
Since the data source has not yet been saved in the catalog, a catalog dialog appears. Navigate to the target catalog folder within the dialog.
Fill in the name, description, and other properties as desired. Shown below is an example name that will be referenced in the next section.
Click
This data source is now stored in the catalog and may be referenced by other components. It is also remembered as a recent data source.
Defining an Analysis Template
Overview
A template defines how to process the data being retrieved from Data Source queries and other data expressions. It also defines formulas, formatting options, and other analysis and presentation options. Team members can define templates which can be easily discovered by others for their running or to use as a starting point for other templates. The overall execution flow for an analysis, including the optional prompt component, is shown below
A single data source can be referenced by name from multiple Qarbine template components. This enables a single point of change when perhaps, an index is added, or some other query tweak is necessary. The alternative is to attempt to find all templates impacted by a schema or index change for example. The component reusability is especially beneficial when team members have varying roles and skills.
Defining the Initial Template
Open the Template Designer.
Open the properties dialog by clicking
The initial property dialog’s data retrieval section is shown below.

. . .

Click on the recent icon .
A component listing dialog is presented.
Select the data source you just saved above. It may not match the highlighted example shown.
Close the dialog by clicking.
The main data reference is filled in.

In this example the “private for q_admin” is the folder path where the data source was saved. You may have saved yours elsewhere.
To close the template property dialog click.
The right hand side of the Template Designer now shows the general schema of the data source.
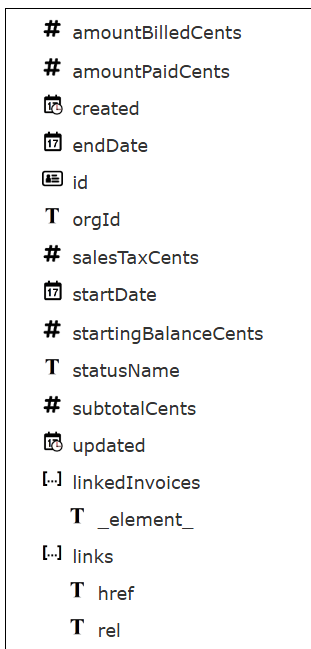
Setting the Cells
Our intended analysis result is a columnar analysis. Here a a picture of the initial cell layout.

For the report header the concatenation function is used to format a heading cell. That cell uses a bold, 16 point font as well. A 2nd report header line below the first one was added by clicking
The group header has a heading to display the year and also a break condition to group the invoices by that property. The latter is set by
- selecting the group header,
- right clicking and choosing “Group properties” and
- specifying a “Break expression” of “year(@invoice.created)”.
All of the group header cells are bolded. This can be done by selecting each of the group header lines and clicking the Bold tool bar button.
The body cells are shown below.
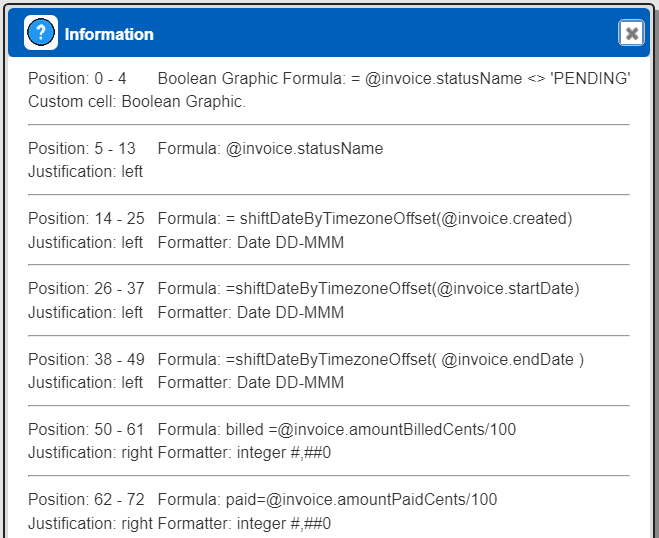
The date gets formatted with the day of the month and the month name via “DD-MMM”.
The group summary cells use Excel-like functions to count and sum values from the invoices.
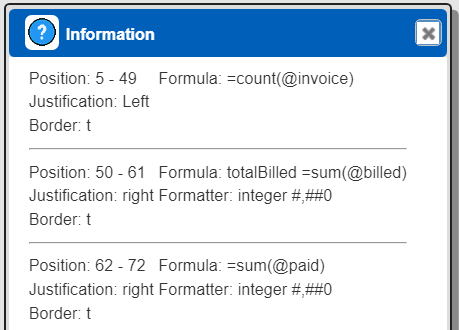
Each cell also has a single top border indicated by the lower case ‘t’.
Running the template at this point for a date range of January 1st through December 31st of 2024 may show.
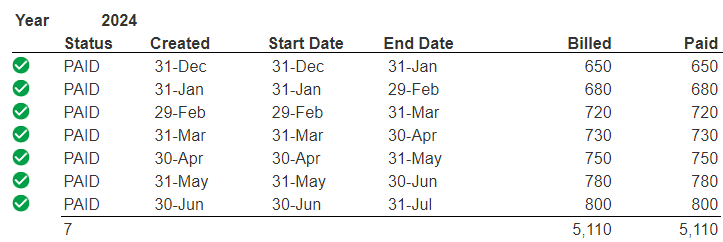
Notice the first created date shows the 31st of December when the running user is located in the New York City area (EDT timezone). Recall from the data source section that we adjusted the date display to use GMT formatting. Initially the timestamp display was
After adjusting it was shown as the desired string in this particular use case.
One way to adjust the date so that the “DD-MMM” formatting makes sense is to shift the date by the offset from GMT using the shiftDateByTimezoneOffset(...) function. The updated body cells are
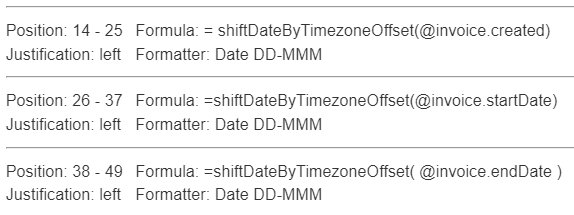
The updated output is shown below.

The output can be exported into various file formats and also be propagated along in a headless fashion within a data processing pipeline.
Saving Your Updated Component
To save your data source click
Since the template has not yet been saved in the catalog, a catalog dialog appears. Navigate to the target catalog folder within the dialog.
Fill in the name, description, and other properties as desired.
Click
This template is now stored in the catalog and may be referenced by other components. It is also remembered as a recent template.
Adding an Percent of Year Total
This addition will show the percentage of the invoice relative to the total for that year. The percentage number and a bar graphic will be shown. For thi a heading is added along with 2 body line cells.
The first added body cell has a formula of
pp = pot(@billed, @totalBilled)
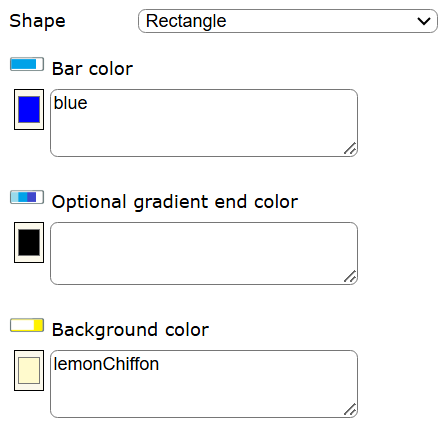
The rightmost body cell is a percentage graphic custom cell. Its formula is
= pot(@billed, @totalBilled)
Its shape and colors are shown below.
Also multi-select the 4 billed and paid cells shown below.
Indicate they are to be formatted as currency by clicking
Running the template now results in the following.

Adding an Invoice Chart
This example can be found in the catalog at “example/MongoDB/Atlas API/Atlas invoices for org with sample data in 2024 plus chart”. It uses sample Atlas billing documents.
Next we will add a chart plotting the overall invoice billed amounts.
Select the report summary line.
Add another line below the selected one by clicking.
Select a grid point on the 2nd report summary line.
On the right side choose
Select
Click
Increase the width
and increase the height
For the formula use
= "Atlas Invoice Amounts"
On the far right, set the chart details by clicking
The plot type and labels are

collect(shiftDateByTimezoneOffset(@invoice.startDate))
Set the minimum Y.
The data series properties are
collect(@invoice.amountBilledCents/100)
The area chart fill color is
The key formatting properties are shown below.
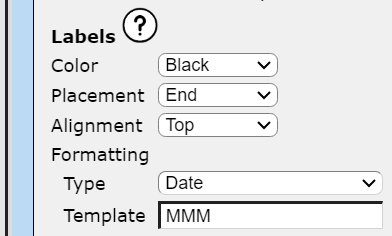
Running the template now results in the following.
Saving Your Updated Component
To save your data source click
This updated template is now stored in the catalog. It is also remembered as a recent template.
Adding Links to Open MongoDB Atlas Web Console Pages
Add another line or two to the report header by selecting the last one and then clicking.
Click a spot below the current cell.
On the right side choose the custom cell shown below.
Then add a new cell by clicking
On the right hand side set the button label.
For a formula enter
= urlAction(concat("https://cloud.mongodb.com/v2#/org/", @org.id, "/billing/overview"))
Perform the steps above for a second button. Use a label of “Payments” and a formula of
= urlAction(concat("https://cloud.mongodb.com/v2#/org/", @org.id, "/billing/paymentHistory"))
The report header section is now similar to the following.
Running the template now results in the following report header output.
Clicking on either button opens the respective MongoDB page.
Saving Your Updated Component
To save your data source click
This updated template is now stored in the catalog. It is also remembered as a recent template.