Adding Images
Overview
This tutorial guides you to adding an image to an analysis template. Many professional looking analysis reports include some image graphics such as a company logo. The logo itself may come from
- an image file placed on the Qarbine server,
- data content,
- a macro function which returns an image, or
- through a specific URL path.
There are macro functions to return well known images such as Qarbine component class images and a few other useful images. In addition, you can use the concat() macro function to dynamically build up a URL from which to obtain an image. In some cases the data itself may reference a URL such as in several popular sample Netflix™ oriented datasets created by database vendors.
Sample Analysis result
Below is an example of using an image for a logo and also to present ecommerce or catalog product images.
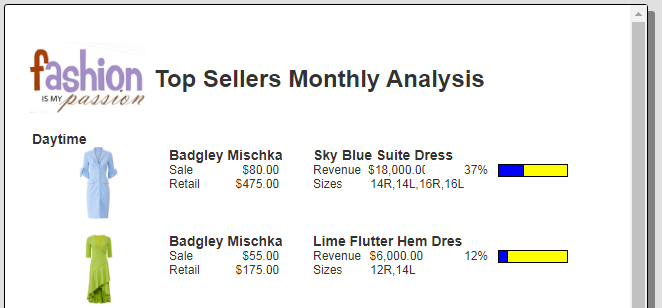
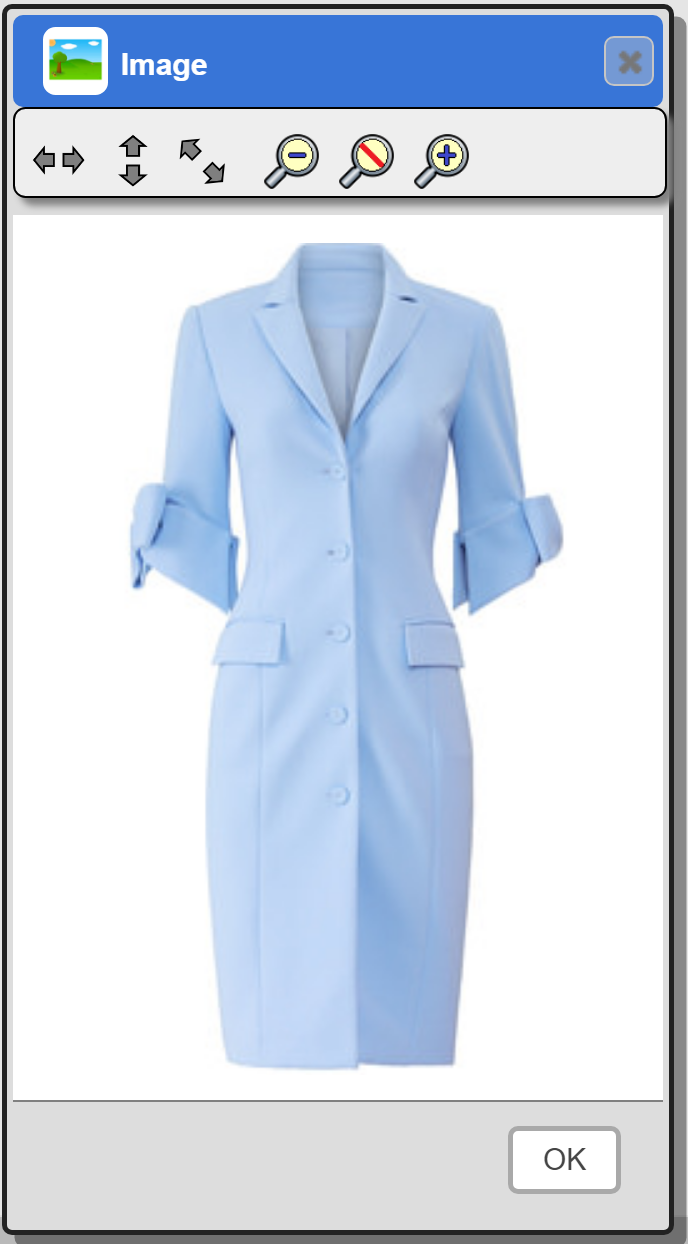
The image shown is likely smaller than the actual size. A dialog to see the image in greater details is just a pop up menu selection away.
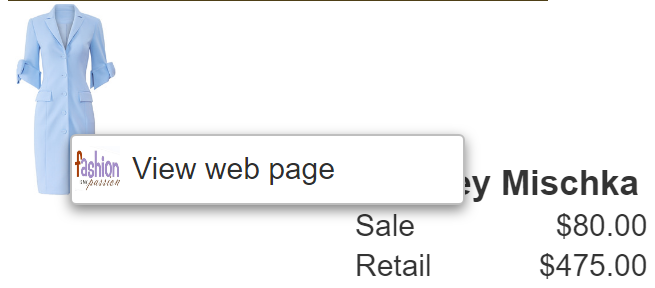
Alternatively you can add popup menu options to perform actions such as calling back into your application or opening a web page as shown below. There can be multiple menu options. A standard left mouse click presents the pop up menu options if any are defined.
A control left mouse click for an image will always show the zoom dialog as shown below.
Basic Steps
Below are the steps to add an image in this example.
- Open your report template.
- In the grid area,click the position in which you would like the logo to start (its upper left).
- On the right hand side, choose “Show custom cells” from the drop down.
- Scroll down in the list and select “Image”.
- Click the “Add Cell” button.
The default image display is to fit without distortion in the space allotted. You can change the width of the image simply by changing the cell width or entering the width on the right hand side. To change the desired height, enter the height in points on the right hand side. There are 72 “points” per inch. For a quarter inch high image, specify 18 points.
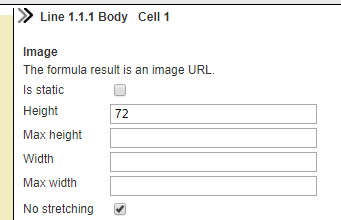
The logo cell uses a static image on the Qarbine primary host. Its formula is
= baseFileUrl("/sampleData/image/rtr/fashionIsMyPassion.png")
Your formula can be a property of your objects as well which is a URL to the image. In this case the cell formula would be something like
= #garmentImageUrl
Bonus Tip
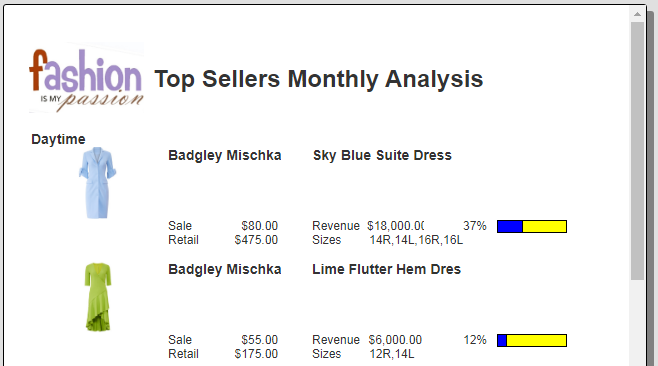
By default the image will push down contain on lines below the line in which it appears. For example, consider a list of garments which includes an “image” field. The image cell formula must be the URL to display the image on a web page. The body section of the following example is defined with an image cell on the left and several property detail cells to the right.

Below is a picture of the default behavior.
If you want an image to span multiple output lines within the same section, then for each line below the one containing the image:
- In the left hand band area, select the line.
- On the right hand side within the line properties uncheck “Start on own line”.
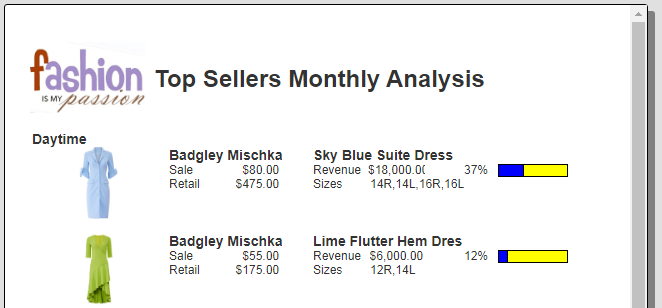
In our example, body lines 2 and 3 will now have “Start on own line” unchecked.
The image will stop bleeding into the lines below once a line from a different section or a line that has “Start on own line” checked is reached. In our example, the 4th line is a spacing line between the garments and does have “Start on own line” checked.
Below is a picture of the resulting output. Notice the image bleeds into body lines 2 and 3 now.
This example can be found in the catalog at
“example/Application/Retail/Fashion is My Passion Top Garments Report”..
It has an accompanying drill down template at
“example/Application/Retail/Fashion is My Passion Sales Analysis Report”.