Athena
Overview
AWS Athena is a query service used to analyze data directly in Amazon Simple Storage Service (S3) using standard SQL. More information on Athena can be found at https://docs.aws.amazon.com/athena/latest/ug/what-is.html. From that page,
In Athena, tables and databases are containers for the metadata definitions that define a schema for underlying source data. For each dataset, a table needs to exist in Athena. The metadata in the table tells Athena where the data is located in Amazon S3, and specifies the structure of the data, for example, column names, data types, and the name of the table. Databases are a logical grouping of tables, and also hold only metadata and schema information for a dataset.
Of particular importance is that Athena supports data structures such as mapped documents and arrays. It is not limited to 2 dimensional rows with simple numbers, dates, and strings. When querying, Qarbine automatically converts the underlying map and array JSON string values into their appropriate rich data structures. There is no casting or unwinding necessary within the SQL unless it is needed as part of the WHERE clause. Athena query results are briefly stored into a writable S3 location as part of the Athena query life cycle.
A useful starting page for Athena can be found at
and information about Athena JSON interactions can be found at
Qarbine can natively query Athena and obtain records such as shown below.
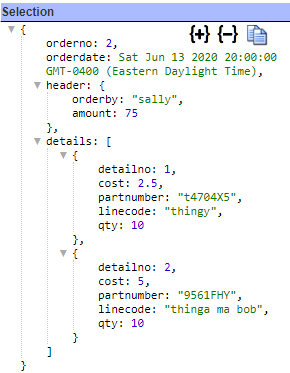
Qarbine can easily analyze this deeply nested data and format an analysis report. This interaction can also be embedded into applications for a seamless end user experience. Sample output is shown below.
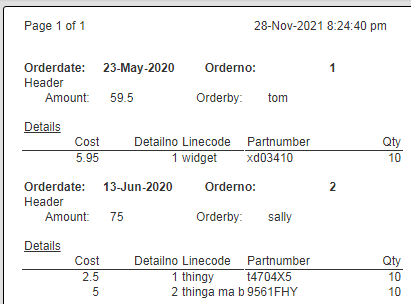
This report result can then be exported into various popular formats and easily shared within leading collaboration tools.
Defining a Data Source
Overview
A Data Source is a Qarbine component responsible for retrieving data from somewhere. At a high level it has a name, a description and some arbitrary query string which when sent to the associated Qarbine Data Service endpoint returns some data. For Athena, the query syntax is SQL and the associated Data Service is one configured to access Athena. The overall execution flow for an analysis, including the optional prompt component, is shown below.
A single data source can be referenced by name from multiple Qarbine template components. This enables a single point of change when perhaps, an index is added, or some other query tweak is necessary. The alternative is to attempt to find all templates impacted by a schema or index change for example. The component reusability is especially beneficial when team members have varying roles and skills.
Using the Data Source Designer
Sign on to Qarbine and navigate to the Data Source Designer.
The initial drop down values are shown below.

Choose your Data Service from the first drop down.
Choose your database from the second drop down.
For information use you can see the recognized tables and views in the left hand area as shown below.
Choosing one displays the table structure defined within Athena.
Running a Query
Enter a query in the text area and click the button.
Selecting one of the rows
shows its details in the right hand area as shown below.
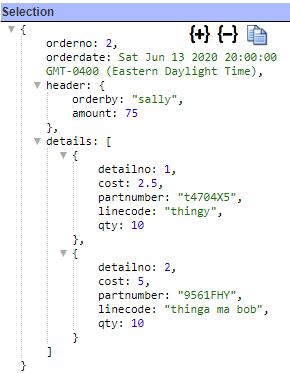
Note that Qarbine has automatically expanded the Athena ‘row’ and ‘array’ data type rows. Expand all of the data structures using to then see the following.
Managing Answer Set Size
The default maximum number of rows starts off at 25 for a new data source. This is useful to evolve a query from a concept to one that you have verified returns the desired answer set. As noted, any native way of limiting an answer set size is the preferred approach. This setting is in the component dialog as shown below and also accessible by clicking the ‘Gear’ icon.

Once you are done drafting you can adjust this parameter. A “0” indicates there is no maximum. A number greater than 0 indicates to limit the final answer set size to that number of rows. This answer set truncation comes after any native query limit. So, if the answer set from the data endpoint is quite large, that content has to be returned to the Qarbine host. It then may truncate the number of rows. It is best to truncate at the query level (i.e., use a limit) to reduce the content sent from the data endpoint to the Qarbine host in the first place.
Adjusting the Maximum Rows
Recall the default maximum rows at the component level is 25. When you are satisfied with your query you can change that setting by clicking.
Adjust the setting to “0” indicating no Qarbine answer set truncation.
Click
Saving Your Work
Click to save the data source in the catalog. It is also remembered as a recent data source.
Creating Initial Components
The query used and the results data can be used to generate a Data Source and a Template component.
Click to create both an initial Template and a Data Source in the Catalog.
Below are sample template values filled in.
Below are sample Data Source values filled in.
Click
Navigate to the catalog folder in which you want to save these components.
Click
In the next dialog presented, uncheck the first checkbox as highlighted below.
Click
Defining an Analysis Template
Overview
A template defines how to process the data being retrieved from Data Source queries and other data expressions. It also defines formulas, formatting options, and other analysis and presentation options. Team members can define templates which can be easily discovered by others for their running or to use as a starting point for other templates. The overall execution flow for an analysis, including the optional prompt component, is shown below
Using the Template Designer
In the steps described above we generated an initial template. This template is shown below.
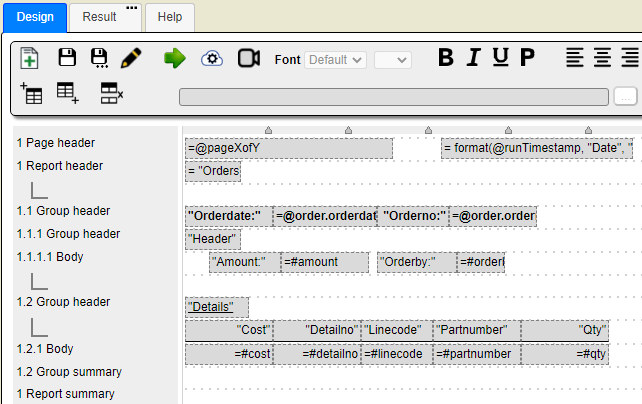
Clicking shows the template’s properties.
Notice the template is associated by name with the also Data Source.

The main retrieval loop elements can be referenced using the ‘order’ variable as noted below.
For example, to access the individual line items the expression would be “@order.items”.
Running this initial template shows the following.
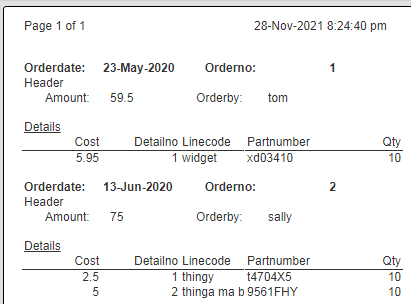
Initial Template Editing
The default generated template has the cells in a default order which should be changed. Let’s rearrange some of the body cells of the template. Move cells around just like you would in PowerPoint.
Next let’s adjust some of the cell labels such as “Orderdate” and “Orderno:”. Select the cell and then edit its formula up the upper left entry field area just like in Excel as shown below.
Tab out or select another cell when done for each cell.
Set the “=#amount” and “=#cost” cells to use currency formatting. Select each one and then click . These cells along with any ones recognized as being numeric by the generator are already right justified for you.
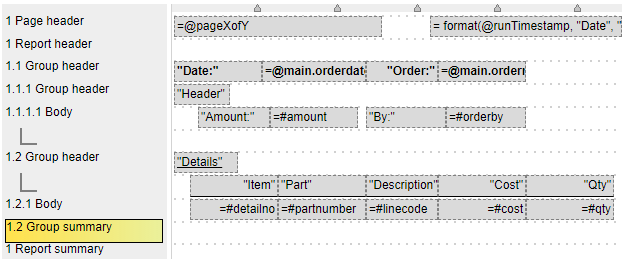
Running this shows the results as shown below.
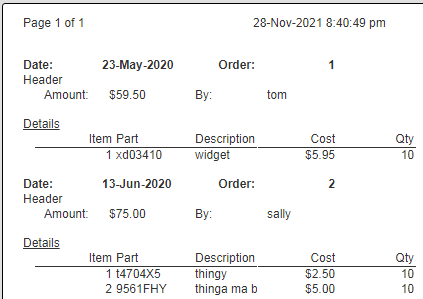
Adding Formulas
We can add additional cells such as a body cell for the “extended cost” of each line item. The formula is “extCost = #cost * #qty”. The’#’ prefix indicates a field name or the current object.
The heading “Ext Cost” has an underline which is set as shown below.
The analysis may be more useful with some aggregate summary information including;
- number of items in the order. This can easily be done via the pop up menu shown below.
The resulting cell is shown below.
- overall quantity of items in the order
- total value of the order can use the formula, totalCost =sum(@extCost).
We add an upper line for this cell as shown below.
To right justify the new columnar set of values, multi-select them and click .
A couple of the new extended cost cells are currencies so multi-select them and click .
With the count and 2 sum cells, another group summary would help the presentation to better segregate different order details. Select the “1.2 Group Summary” line, right click, and choose the menu option noted below.
Our updated formatted result is shown below.
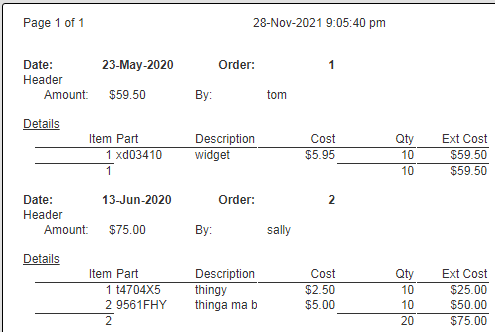
Adding Grand Totals
Finally, it would also be useful to have some overall values for all of the orders in this analysis. For each of the 1.2 Group Summary cells.
Adjust the first cell to have the formula, orderItems =count(#detailno).
Adjust the second cell to have the formula, orderQuantity =sum(#qty).
For each of the 2 cells select it, right click, and choose the option noted below.
The report summary line now contains these 3 cells.
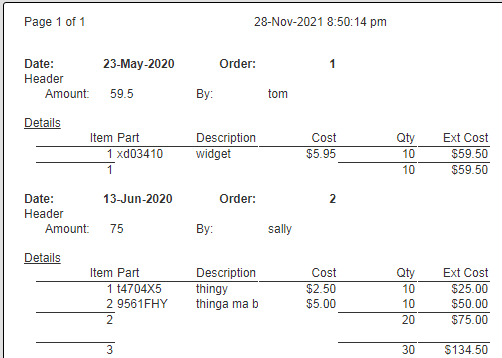
Running this results in the following output.
Save Your Work
Click to save the template in the catalog. It is also remembered as a recent template.
Sample Athena Data
Data Row 1
{"orderno": 1, "orderdate" : "2020-05-24", header: {"orderby": "tom", "amount": 59.50}, details:[{detailno:1, cost:5.95, partnumber:"xd03410",linecode:"widget", qty:10} ] }
Data Row 2
{"orderno": 2, "orderdate" : "2020-06-14", header: {"orderby": "sally", "amount": 75}, details:[{detailno:1, cost:2.50, partnumber:"t4704X5",linecode:"thingy", qty:10},{detailno:2, cost:5.00, partnumber:"9561FHY",linecode:"thinga ma bob", qty:10} ] }
Structure Definition
CREATE EXTERNAL TABLE  order_plus (
  orderno int, orderdate date,
  header struct<orderby:string,amount:double>,
  details array<struct<detailno:int,cost:double,partnumber:string,linecode:string,qty:int>>
  )
ROW FORMAT SERDE
  'org.openx.data.jsonserde.JsonSerDe'
STORED AS INPUTFORMAT
  'org.apache.hadoop.mapred.TextInputFormat'
OUTPUTFORMAT
  'org.apache.hadoop.hive.ql.io.IgnoreKeyTextOutputFormat'
LOCATION
  's3://MY_BUCKET/’
Next Steps
Accessing Your Database
To configure access to your database see the guides at
http://doc.qarbine.com/docs/category/data-service-configuration
Querying Your Database
For database specific interaction guides navigate to
http://doc.qarbine.com/docs/category/data-source-designer