Template Designer Guide
Overview
The Template Designer captures how to retrieve, analyze, and present your data. Shown below is the execution flow with the optional initial Prompt component providing dynamic query parameters.

The main query results flow into the template for analysis and other processing. The template may define additional data retrieval steps which may access remote data or traverse the objects from previous retrievals. For example, a NoSQL database may return a list of portfolio objects and each of those may have embedded stock and bond arrays. Rather than retrieve the stocks and bonds using remote query requests, the data is already part of the portfolio object and readily available to use.
When a template wants to use a prompt to obtain runtime values a reference to the prompt is set in the template’s properties dialog. Likewise, in general the template references a data source to obtain its main data to process. Templates can also be defined with data retrieval directly specified within itself. This can range from remote data server queries to simply navigating a data object that contains a list of child elements to traverse.
Core Concepts
Overview
The template structure is similar to a document outline (as in a table of contents) where there is a hierarchy of parent, child, and peers. The structure indicates how to traverse the data, retrieve any additional data, and how to interact with and present the data. After any optional prompt is present the data retrieval occurs. This result list is then consumed per the template specification.
See the Tutorials section for a variety of “How To” guides and examples.
Outline Structure Concept
There are several sections that make up an analysis template. Each section can contain multiple lines as well. Some, like the page header and footer are optional as well. The general structure is depicted below.
| Level | Section |
|---|---|
| 1 | Page Header |
| 1 | Report Header |
| 1.1 | Group Header |
| 1.1.2 | Body |
| 1.1 | Group Summary |
| 1 | Report Summary |
| 1 | Page Footer |
The level "outline notation" is important because of the supported nesting and peering options. The dot notation is used to cross reference feedback and errors.
If you have an analysis on a document object containing two embedded arrays the structure may look like the following with each group handling one of the embedded arrays.
| Level | Section |
|---|---|
| 1 | Page Header |
| 1 | Report Header |
| 1.1 | Group Header |
| 1.1.1 | Body |
| 1.1 | Group Summary |
| 1.2 | Group Header |
| 1.2.1 | Body |
| 1.2 | Group Summary |
| 1 | Report Summary |
| 1 | Page Footer |
Group 1.1 will be used to iterate through the first child list (i.e., an embedded array). Group 1.2 will be used to iterate through the second child list. The page header and footer sections are optional as are even the report header and report summary sections. Their display is also controlled by template formatting options.
Template Section Processing
The Report Header section is processed once at the beginning of execution. Likewise the Report Summary is processed once after all of the main data has been iterated through. Each section can consist of zero, one, or many lines.
After the Report Header is processed the template group indicates how to iterate over the data. Each group has a Header section and a Summary section. Within each group is either a Body section or child groups. Eventually there is some Body section within a group hierarchy.
Each section is composed of cells with formulas and formatting specifications.
A simple layout looks like the following.
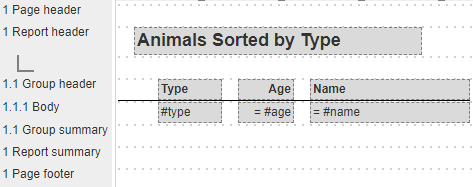
This template includes page headers and footers. Based on other template options these sections are processed during processing. These sections may be removed or suppressed from the display as well.
Sample results from this very simple template may look like the following.

During processing the query is run and the results list of animals consumed by the analysis engine. The report header is formatted followed by the group header. For each result list element the body section is processed. This body only has a single line but sections may have more than one line. The Body cells each extract and format field values from each element.
Once there are no more result list elements the group summary is processed and then the report summary. If the page footer is active, then it too is processed. Processing then concludes.
Qarbine is built to handle the complex data requirements of modern data. This includes embedded documents and embedded arrays. Below is the layout structure for an analysis of portfolio objects whereby each portfolio object contains an embedded stock array and an embedded bond array.
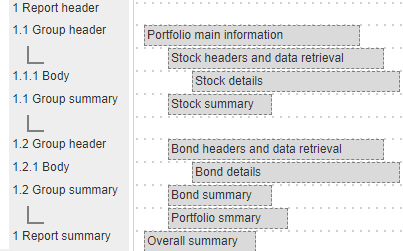
The template's main data retrieval obtains a list of portfolios. The report header section is processed.
Group 1.1 would then retrieve the stocks from the current portfolio and its inner body would iterate through them to format the details. Once done with the stock list the next group gets control. It iterates through the portfolio’s bond instruments in a similar manner. When all the bonds have been gone through, the 1.2 group summary is processed. If there are additional portfolios in the main retrieval (i.e., not end of data) then processing loops back to 1.1 group header to continue as before. This example covers the simple processing case.
Eventually there are no more portfolios in the main retrieval result list and the report summary is processed.
Groups
Groups are primarily used to iterate through lists. The lists can come from:
- a data formula
- a cataloged data source component, or
- an inline data source
For the first case, if you have a document with an embedded array, simply define a data formula to obtain the data. An example with a portfolio object variable named 'myPorfolio' that has a stocks field would be.
@myPorfolio.stocks
For the 2nd case, simply choose the data source from the catalog. This is a reference meaning that the latest definition of the components will be loaded during execution.
The 3rd option allows you to define all the core properties of a data source, without having to define one that is stored in the catalog. It is quick and easy to define, but the tradeoff is that your query only resides in the template. It is not in reusable form.
Opening the tool
You can access the Template Designer in several ways. Tools can be opened from the signOn page, the home page, and from various tools using the hamburger  menu.
menu.
From the Home tool.
Alternatively you can open the tool from the hamburger menu on each tool.

. . .

Pressing the control key during the menu click opens the tool in another tab.
Tool Layout
Overview
The layout of the Template Designer has 2 primary toolbars at the top of the window. The top one has the primary component level buttons on the left followed by the main formatting buttons. 

The secondary toolbar has line buttons on the left and cell specific widgets on the right.


The other core areas are noted below.
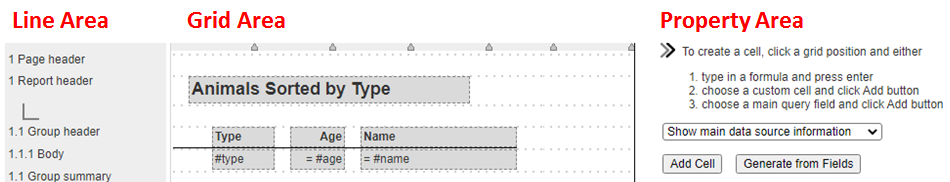
The lines are depicted on the left hand side in an outline’ish manner. The main grid area contains the cells. This is similar to Microsoft Excel except there are no rigid column centric cells. When a line or cell is selected its properties are shown in the right hand area. This area also provides other options when there is nothing selected.
Template Toolbar Buttons
These toolbar options are described below.
 | Start a new template. |
|---|---|
 | Save the component. |
 | Perform a “Save as” |
 | Open the properties dialog. |
Processing Toolbar Buttons
These toolbar options are described below.
 | Run the template. |
|---|---|
 | Specify the compute node you want to run on. Access to this feature varies by Qarbine feature level. |
 | Record the retrieved data so it can be played back without running a retrieval query. |
Common Formatting Toolbar Options
Several buttons may be applied to lines or cells. These toolbar options are described below.
These toolbar options are described below.
 | Apply bold style. |
|---|---|
 | Apply an italic style. |
 | Apply an underline style. |
 | Reset the style. |
   | Apply left, center, or right justification. |
 | Apply paragraph word wrap justification. |
    | Apply default numeric, currency, percentage, or general formatting. |
   | Cut, copy, and paste clipboard operations. |
 | Delete the selection. |
Line Toolbar Buttons
These buttons apply when a line is selected in the left hand line area. The options are described below.
 | Add a line above the selected one. |
|---|---|
 | Add a line below the selected one. |
 | Delete the selected line. |
Cell Toolbar Buttons
These buttons apply when a cell is selected in the grid area. The cell formula is filled into the topmost entry field.
 The options are described below.
  | Open a formula editor. |
|---|---|
  | These buttons nudge the cell left or right. Pressing control when clicking shifts the cell to the maximum extent possible in the given direction. |
  | These buttons nudge the cell width more and less. Pressing control when clicking shifts the cell width to a preferred minimum or maximum size. |
   | These buttons are used to find the text in the find entry field, find the next occurrence, and find the previous occurrence. |
Other Toolbar Buttons
There are several other buttons which are described below.
 | Present cell placement options when multiple are selected. |
|---|---|
 | Open the dialog for report and group level calculations.. |
 | Open the dialog listing all of the formulas. |
  | Undo and redo. |
Data Retrieval
Overview
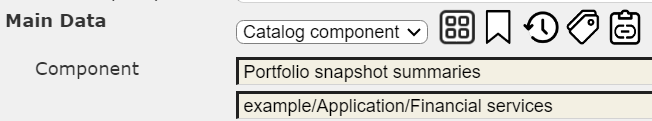
All templates have a main data retrieval. This is accessed by clicking the toolbar button to open the Properties dialog.

Toward the bottom of the dialog tab you can limit the amount of data used from a data retrieval using by specifying the “maximum elements” value. In this tab you can also set a variable name for your current element value. This is especially important when multiple data retrievals are being used by a template. It is a way of fully qualifying objects in your formulas.

The elements of the main data retrieval may themselves have inner lists of data. In MongoDB and JSON terms this is an embedded array. Qarbine groups enable iterating through these inner lists. This is discussed below in the “Group” area.
Referenced Data Source
This is the most common approach used as it promotes reusable data sources and allows a data source to be optimized or updated independent of any of its consumers. As long as its data retrieval “contract” with its consumers is maintained, “all is well”.
You can select a data source using one of the tool buttons described below.
 | Open a general catalog selection dialog. |
|---|---|
 | Choose from your favorite data sources. |
 | Choose from your recent data sources. |
 | Choose a data source by searching based on name or tags. |
 | Paste a data source reference. |
Inline Data Source
This option allows you to embed data retrieval directly in the template. You’ll likely first test out the query using the Data Source Designer, Query by example, or other favorite query tool. This approach can be applied at both the main template level and for any group. Recall that template groups may themself perform data retrieval steps during the course of template processing.

Macro Function Formula
This option is commonly used when embedded analysis and data is being passed in. The source application sets the given variable and requests the template to run with that data list. A simple example of this is shown below.

There are several macro functions which can retrieve various data as well. To get a list of visible catalog folders the following formula can be used.
folderNames = catalogFolders()
For testing template concepts you can use the very simple formula such as the following.
listWith(1)
Formulas
Macro Language Overview
Qarbine formulas are similar to those found in Excel. The Qarbine macro language function summary document can be found in the Macro Language Functions document. A few of the functions described are only available at higher Qarbine feature levels. Formulas can be used in many spots across Qarbine. Their use is not limited to cell formulas. For example, a cell’s text color and background color may be driven by formulas. Prompts can use them for populating lists as well.
Cell
The majority of formulas appear as cell formulas. There are several rules to keep in mind.
- A ‘#foo reference refers to the field value named ‘foo’ of the active data object.
- A ‘@foo’ refers to the variable name ‘foo’.
- You can use dot notation to extract deep object values such as @person.address.state.
Formulas may also be used for formatting cells such as specifying a color. Expressions such as these may range from a constant ‘red’ to macro expressions such as one used to set the background color
if (#value < 50, ‘red’, ‘white’)
Line
The formulas used by lines are mainly in the areas of process conditions, colors, and pagination.
Group
The formulas used by groups are mainly used to indicate whether to continue to process the group itself. For example, you may want to only process a group if data meets certain criteria. You may also have a set of peer groups with each group designed to process a particular type of object. Groups can also have non-cell formulas which are evaluated just prior to the group headers being processed.
Report
Report level formulas are non-cell formulas which are evaluated just after the data retrieval occurs and prior to the report headers being processed.
Common Public Variables
During template processing several variables are automatically set. They are described below.
| Variable | Comment |
|---|---|
| pageNumber | The current page number being formatted. |
| totalPages | The total number of pages created. This is not known until the end and can be used in two pass formulas. |
| current | The currently retrieved data object. |
| previous | The previously retrieved data object. |
| objectNumber | The number of objects retrieved in the currently active data retrieval. If the data retrieval is inside another one then the number is reset for each query run. |
| bodyObjectNumber | Increments as a body section asks for the next element from the current data retrieval. |
| totalDataObjects | Increments as a data object is read from any main or group data retrieval setting. |
| runTimestamp | When the processing started. |
| maxObjects | The maximum number of objects to retrieve for the main data retrieval. The data source may specify a value. The template’s inner data may override this value. If neither does then this variable is null. It is useful to provide feedback that a limited number of objects may have been used by the template. |
| <elementName>Number | Inner data retrievals can specify element variable names. This variable value is incremented as each element is read. If the data retrieval is inside another one then the number is reset for each query run. |
| <elementName>Total | Inner data retrievals can specify element variable names. This variable value is incremented as each element is read. |
Aggregate Formulas
Overview
Excel users are familiar with SUM, AVG, MIN, MAX, and other aggregate functions which operate over a series of values. Qarbine provides similar formulas and extends their functionality by providing trigger and reset conditions. The general syntax of an aggregate is
aggregateName(expression, triggerCondition, resetCondition)
The trigger and reset conditions are optional. They are derived from the variable references in the expression. For fine grained control use the activeLevel(), activeSection(), and activeLocation() functions.
Available Aggregate Functions
The available aggregate functions are listed below.
| sum | Total up the values. | count | Count the non null values. |
|---|---|---|---|
| min | The minimum value. | distinct Count | Count the distinct values. |
| max | The maximum value. | distinct CountOf | Count the number of occurrences of a value. |
| track Min Element | Track the element with the minimum value. | collect | Collect the values. |
| track Max Element | Track the element with the maximum value. | ||
| first | Save the first value. | stDev | The standard deviation. |
| last | Track the last value. | stDevP | The standard deviation of a population. |
| avg | Determine the average. | var | The variance. |
| mean | The mean of the series. | varP | The variance of a population. |
| mode | The mode. | range | The range of the values. |
The percent of total function signature is shown below
pot(expression, totalReference)
The use of percent of total calculations is described in more detail here.
Sample Aggregate Formulas
Aggregate cells can be created like any other template cell simply by clicking free grid spot and entering a formula. There are also some convenient popup menu options as shown below.
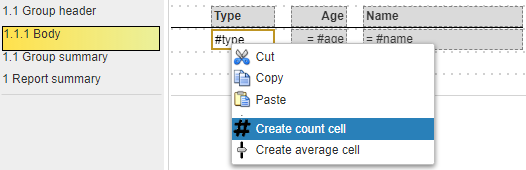
Below is a simple set of template lines

The group summary line’s cells are shown below.
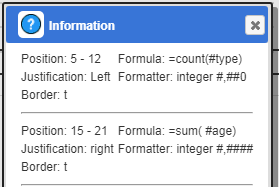
These aggregates using the shortcut ‘#fieldName’ notation to obtain values because there is only a single data retrieval occurring.Their result is not used by any other cells so no result variable is specified.
Multi-Level Aggregates
A common use case for multi-level aggregates is for subtotals and a grand total. A sample template can use the following inline data source to retrieve cats and dogs.
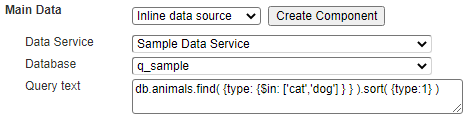
Using these lines

the output results are shown below.

Now let’s adjust the cells so that we segregate the cats and dogs by having a group break on #type, have aggregates for each type, and also have overall aggregates in the report summary.
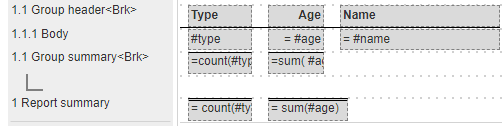
The new output is shown below with the type subtotals and the grand totals.

Aggregate Considerations
Qarbine supports traversing a large variety of data structures. For example, some modern data contains embedded documents and embedded arrays which in turn contain other complex objects.
Consider a template with the main retrieval.

. . .

The layout is shown below

General Formatting
Overview
The general formatting options revolve around cell placement on their lines and basic line properties.
Cells
Cells are placed on a line and have a starting and ending position. A variety of formatting options are available from the toolbar area which are similar in nature to Microsoft Word and Google Docs.

The word wrap icon interacts with line output processing and is described in more detail below. The buttons to its right are shortcuts to setting the cell’s output format.

The basic formatting options can be adjusted in the right hand area as shown below.

Cells can be formatted to display borders and show a shadow. These options are shown below.

The background and foreground text colors may be set using constants or formulas.
Lines
The basic line properties are shown below.
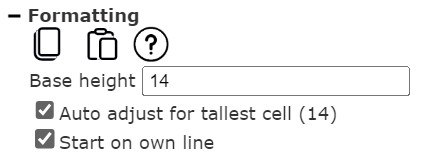
Usually you want to vertically allocate enough space to fit the tallest cell. Sometimes this is not known until an analysis is run and it may also vary by data element. The “Start on own line” setting comes into play when a cell’s output has multiple lines such as when a cell has paragraph (wordwrap) formatting. Consider these 2 lines with the first containing a paragraph cell and last name information. The second line shows the first name.

Using the line default behavior of starting on its own line we see.

Unchecking “Start on own line”

allows a previous line to have its output blend into this line’s output. This can be useful when formatting descriptions and you would like the content to blend together.

Shown below is an example of blending lines together. Both the left hand image and the right hand right hand amenities text blend into subsequent lines.

Lines can be formatted to display borders and show a background containing all of their cells. The default is a black border and a white background.

These colors may be adjusted using the options below.
The 'Right edge' setting is used when rendering any border or background color.

If the template has an associated Style Set support, then lines can also reference a Line Style using the drop down noted below.

When a line is selected you can also click on the formatting toolbar buttons to apply that action to all of the cells.

Conditional Formatting
Overview
Modern data can be very dynamic with the existence of some fields varying across the returned data. This necessitates conditional processing to be available for cells, lines, and even groups.
For example, rather than have the line's cells show 'null' or encounter formula exceptions, you can specify whether or not to even have this line's cells end up in the result. You can have one line with cells focused on one type of data and another line a different type of data.
Cells
Individual cells can be skipped by setting a formula in the field noted below.

This is a very useful feature given the dynamic structure of modern data. Unlike relational database answer sets that are homogeneous in structure, NoSQL and JSON savvy databases store data spanning a variety of structures.
In addition, duplicate cell output values based on their previous result can be suppressed. Below is output where the #type cell has default behavior.

Changing the #type cell to have

results in the following which is easier to read.

Lines
Individual lines can be skipped by setting a formula in the field noted below.

In addition, the timing of when that expression gets evaluated is set using the checkbox shown below.

Usually this determination can be made prior to processing all of the cells on the line. This is more efficient. However, there are cases when the determination makes sense after the cells have been processed. An example is a line which formats order line items and the analysis is to only include line items whose values exceed a threshold. If the threshold is not met then the result cells for that line are backed out.
In our simple animals template we can add the following to the body line

The result is shown below.

The manner in which page breaks are triggered can be controlled at the line level as well. A frequent use is to make sure there is a certain amount of space available on a page. There are 2 formula fields supporting this pagination control and each expects a boolean result.

Groups
A group has a header section, summary section, and either an inner body or inner groups. Groups may be entirely skipped in 2 ways. Groups can be conditionally processed by specifying a macro formula which returns a boolean.

. . .

In addition, if the group has a data retrieval it may be entirely skipped by checking the checkbox below.

Using Colors and Borders
Overview
A variety of text color, background color, and borders can be applied to your formatted analysis
In addition, there are many custom cells that present information graphically or use multi-media controls. Together there is a rich palette of presentation options.
Cell
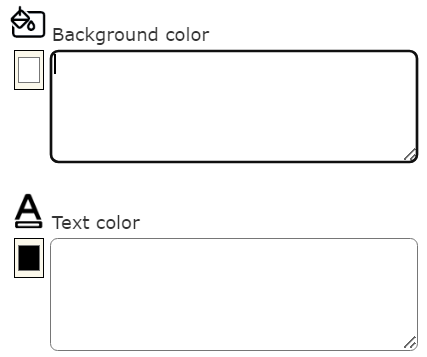
Cell colors can be defined using the options shown below.

The final value is an RGB color, a color name, or a hexadecimal RGB value. Qarbine’s extreme flexibility allows formulas to be used in these options. For example, consider this background formula
if(#value < 0, ‘red’, null)
You can also achieve different colors based on numeric ranges, string comparisons, and other logic. See the “Working with Colors” document in the Tutorials section for more information.
Line
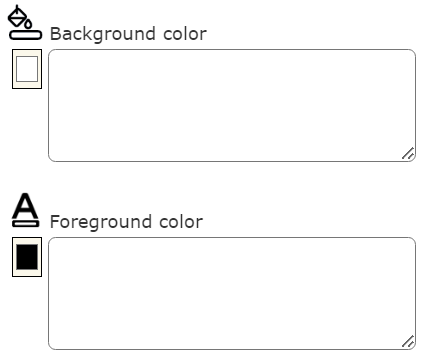
The border options for a line are similar to a cell and are shown below.

The line’s border will generally go around all of its cells. The right edge position is controlled by the dropdown shown below.

The line’s output can include a background color and the line’s result cell text color can be set as well using the formula fields below.
A cell can override these by explicitly setting the colors.
JSON Data Interactions
Overview
Modern data tends to have very rich data structures with a single object containing other objects and even arrays of objects.
To view the general data retrieval settings across the template, on the right side of the tool choose the dropdown option shown below.

Below is example output for a portfolio analysis template.

Custom Cells
Overview
Qarbine provides a plug-in framework to extend the types of data processed and how it is presented. Given the powerful text formatting features in Qarbine, many of the included custom cells are more graphically oriented. To access the list of available custom cells, on the right side of the tool choose the dropdown option shown below.

There are several other documents describing the use of custom cells. See the Custom Cell Summary document for a summary and the various how to” guides for sample use including:
- How to add an image.
- How to include a MongoDB Chart in a template.
- Embedded deployment using checkboxes, buttons, and popup menus.
Runtime Prompt Dialogs
Overview
Qarbine provides a no-code dialog tool to prompt for runtime values. This framework is also extensible through “Custom Prompts'' which enable developers to present more complex dialogs to users.
Setting a Prompt
A prompt reference is set by opening the template properties dialog and activating the tab shown below.
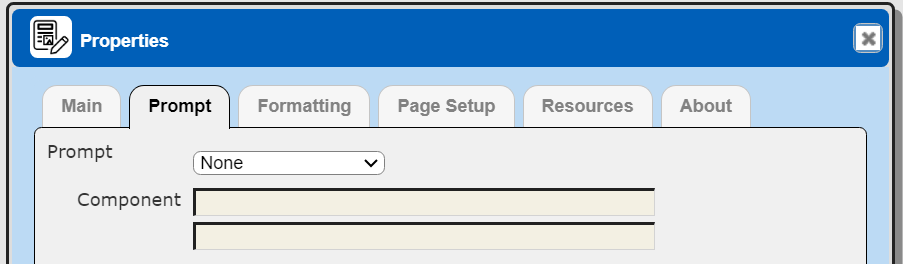
Change the dropdown as shown below.
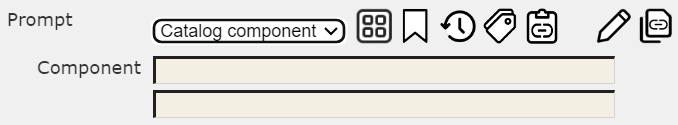
You can then select a prompt using one of the tool buttons described below.
| Icon | Description |
|---|---|
| | Open a general catalog selection dialog. |
| | Choose from your favorite prompts. |
| | Choose from your recent prompts. |
| | Choose a prompt by searching based on name or tags. |
| | Paste a prompt reference. |
The other button descriptions are below.
| Icon | Description |
|---|---|
| | Open the Prompt Designer. |
 | Copy the prompt reference. |
Advanced Formula Uses
Report and Group Level Formulas
There are circumstances when you want to perform some calculations independent of any template cell. This can be done at the report level or a group level. Click on the icon highlighted below to access these calculations.

The drop down indicates the level in which the calculation is evaluated.
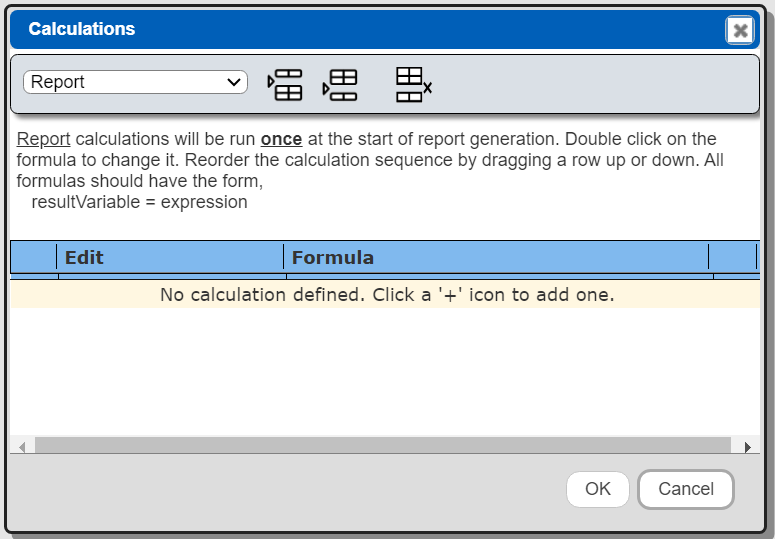
The report level calculations are done once, just after reading the first main retrieval element. Each defined group is listed in the drop down as well.
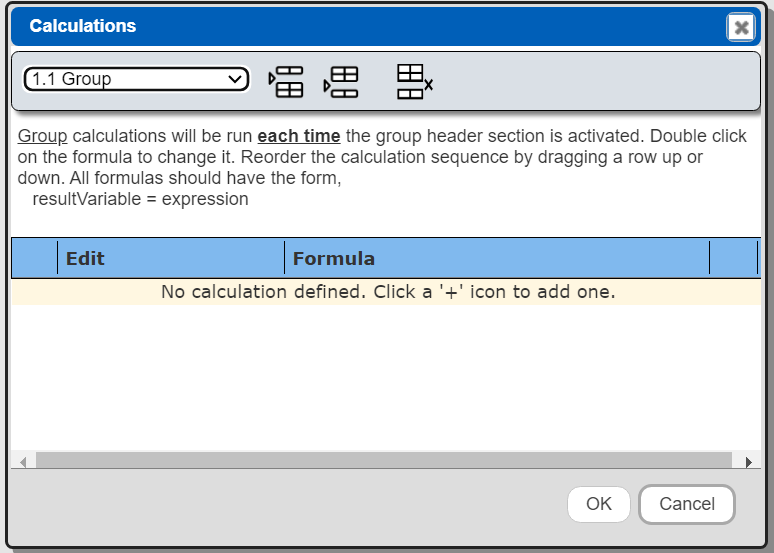
The toolbar buttons  enable adding and removing the calculations. To reorder to calculations simply drag an element up or down in the list.
Counters
The increment() and decrement() functions can be used as counters with automatic initialization. Their signatures are:
variable = decrement(variableName [,initialValue])
variable = increment(variableName [,initialValue])
Group header would set the variable to 0 via
myCounter = 0
The body would then use a formula
myCounter = @myCounter + 1
or
myCounter = increment(‘myCounter’)
Running Totals
For running total you first decide when to set the value to zero. This can be by using a group header or report header formula or calculation (a non-cell expression).
myRunningTotal = 0
Inside that area you can then use a formula such as the following
myRunningTotal = @myRunningTotal + someValue
The running total will be reset if the initialization is done on a group header and the template processing loops back around to that header .
Defining Data Access
Groups are primarily used to iterate through lists. The lists can come from:
- a data formula
- a cataloged data source component, or
- an inline data source.
For the first case, if you have a document with an embedded array, simply define a data formula to obtain the data. An example with a portfolio object variable named 'myPorfolio' that has a stocks field would be.
@myPorfolio.stocks
For the 2nd case, simply choose the data source from the catalog. This is a reference meaning that the latest definition of the components will be loaded during execution.
The 3rd option allows you to define all the core properties of a data source, without having to define one that is stored in the catalog. It is quick and easy to define, but the tradeoff is that your query only resides in the template. It is not in reusable form.
Group Definition
Overview
Recall there are several sections that make up an analysis template. Each section can contain multiple lines as well. The general structure is depicted below.

Conditional Processing
Modern data can be very dynamic with the existence of some fields varying across the returned data. Complete groups can be bypassed by specifying a condition formula. This could be a simple is not null check, isNotNull(#pets), or a more complex formula.

Inner Data Lists
As mentioned above, groups iterate through some data list. A template's main data elements may have their own inner data items. This can be through direct embedded arrays or indirectly through another query of some sort. The means to obtain this list is specified in the dialog area shown below. For a portfolio object with embedded stocks and bonds arrays the formula for one the groups may be '#stocks'. If the template's main data option specifies a variable named 'portfolio' then the group's data formula could be '@portfolio.stocks' as shown below.

Alternatively you can reference a Data Source component which may have variable placeholders to obtain values.
The left hand "outline notation" is important because of the supported nesting and peering options. The dot notation is used to cross reference feedback and errors. For example, if you have an analysis on a document containing two embedded arrays the structure may look like.

Group 1.1 will be used to iterate through the first embedded array. Group 1.2 will be used to iterate through the second embedded array. The page header and footer sections are optional. Their display is also controlled by template formatting options.
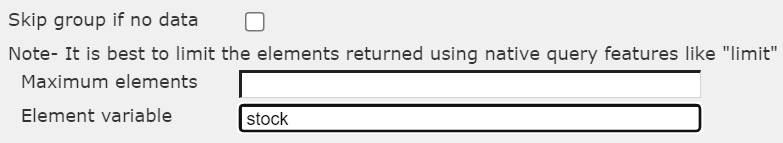
There are several other group data options as shown below. The "Skip group if no data returned" option is useful when you perform a data retrieval, realize there are no items, and do not even want to format the group header or anything else. The class instantiation option is only applicable when your data has a '_class' field and you have a Qarbine resource which implements the associated class's behavior.
Control-breaks for Grouping Data
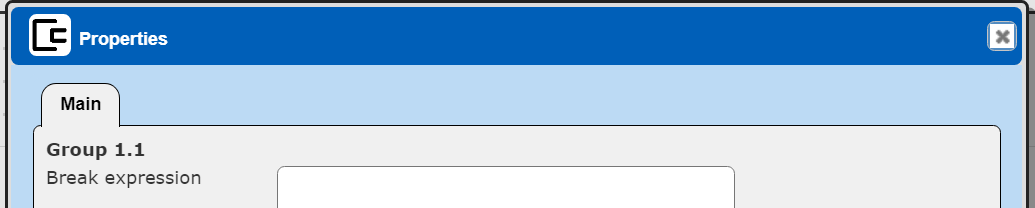
The break condition is set in the Group Properties dialog as shown below.
Consider the following query and result.
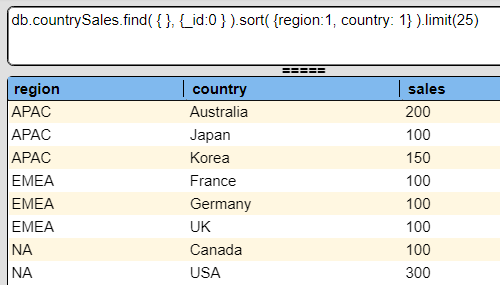
By defining a control-break on the region via “#region”, the following can be easily generated.
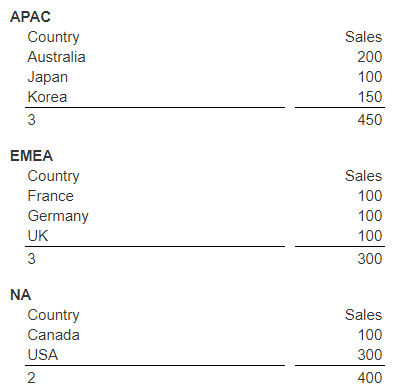
See the “Group Analysis using Break Conditions” document in the Tutorials area for more details.
Viewing Results
Page Navigation
A template’s formatting options indicate how to display the result.
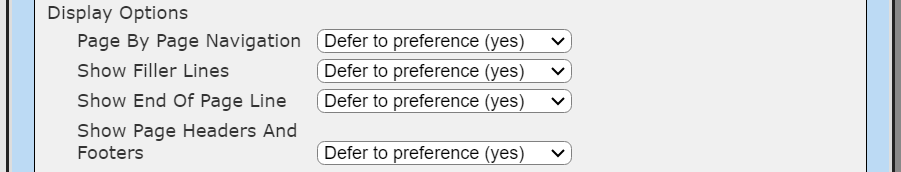
The result toolbar includes information of how many total pages were generated. You may choose to show all the pages at once or navigate them one by one. For example, for a 2 page result this setting

shows the following in the result toolbar

and one page at a time is shown.
Alternatively this setting

shows the following in the result toolbar

and all of the pages are shown.
Below is a table cross referencing the toolbar result page navigation icons.
| Icon | Description |
|---|---|
 | Go to the first page. |
 | Go to the previous page. |
 | Go to the next page. |
 | Go to the last page. |
Finding Text
The searching for text does span pages in the forward direction.
| Icon | Description |
|---|---|
| | Find the first occurrence of the string starting on the current page. |
| | Find the next occurrence of the string. |
Zooming In and Out
The result content may be zoomed in and out for your reviewing needs.
| Icon | Description |
|---|---|
 | Zoom out. |
 | Reset the zoom to “none”. |
 | Zoom in. |