Overview Bucket List Tour
Signing On
If you are using the online Qarbine sandbox then see the Sign Up and Support document for the basics of signing on to the sandbox. Otherwise you are likely already signed on to your Qarbine deployment.
Sample Data Configuration
The Qarbine Sandbox is set up to access the standard MongoDB Atlas sample data which includes the mFlix and AirBnB data sets. The following provides a guided tour of the core components and tools going from ad hoc querying through embedded analytics.
General Navigation
Tool Navigation
Qarbine is a suite of tools with varying uses as described below. You can directly open a specific tool by choosing it on the log on page and you may log on to Qarbine across multiple tabs. In each tool, the File menu option provides navigation to the other tools. This is shown below in the Home tool.
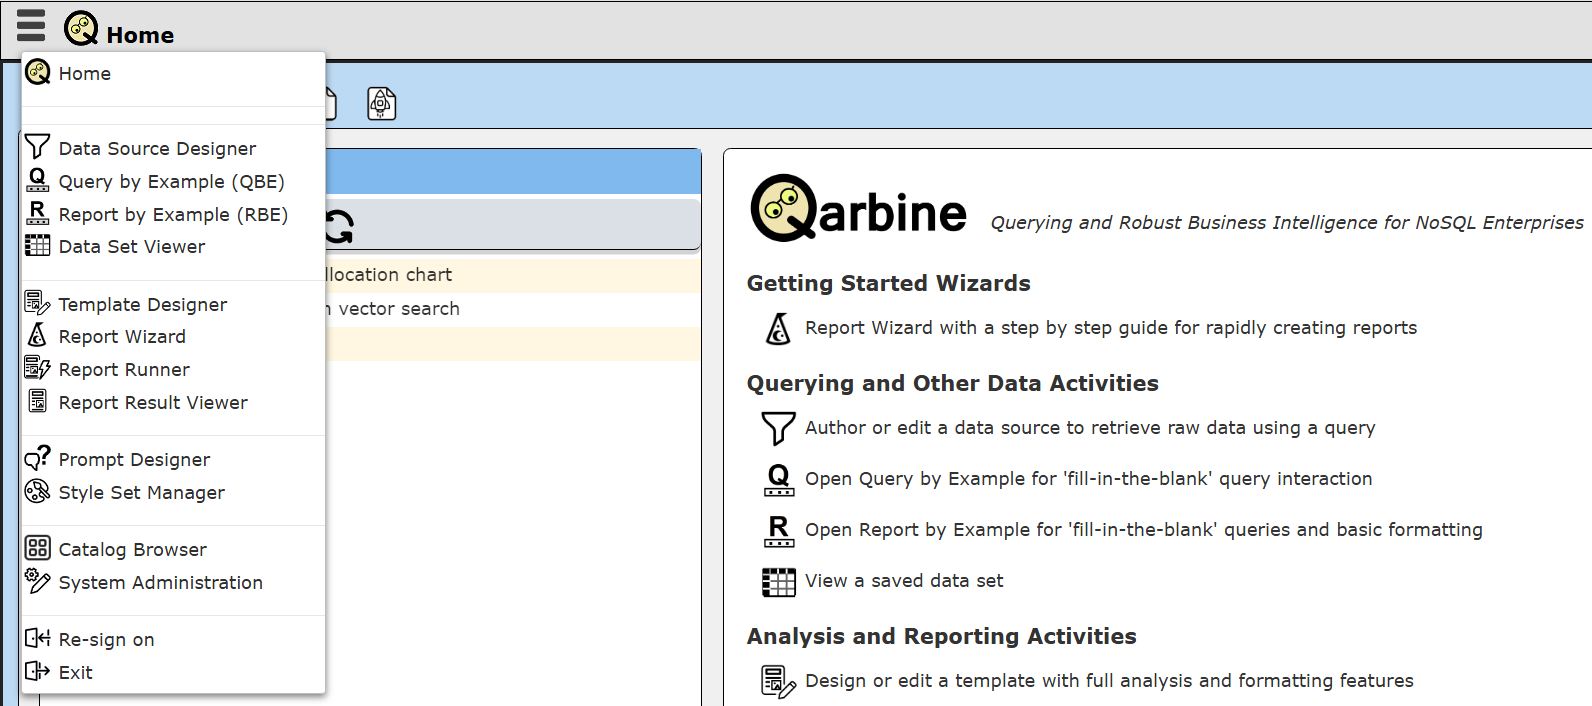
Clicking “Catalog Browser” for example opens the Catalog tool in this tab. Pressing down the control key and clicking “Catalog Browser” will open the tool in a new tab.
Component Navigation
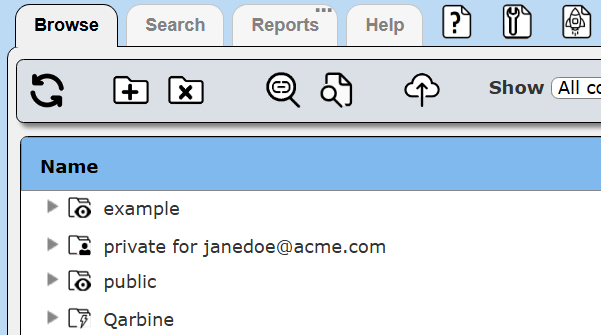
All Qarbine components are stored in the shared Qarbine Catalog. The look and feel is similar to a folder oriented file system familiar to desktop users. Each top most folder has permissions which vary from run-only, view-only, to read-write. The Qarbine administrator determines which root folders are visible to a user and their associated permissions for any particular user or user group. Each signed on user also has a private root folder which is read-write for them and not visible to any other users. Depending on the permissions, other folders can be created as well.
Quickly Seeing the Main Components in Action
Data Source
The Qarbine Catalog stores many types of components. A data source component's sole purpose is to retrieve data. Open a Data Source Designer from any tool as shown below.(You can press the control key prior to the menu selection to have a new tab open).

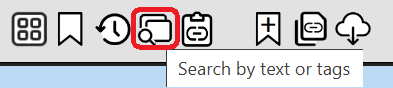
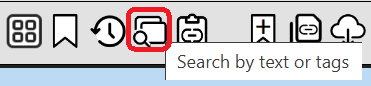
Click the highlighted button.
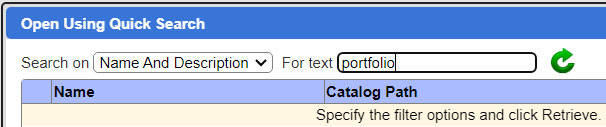
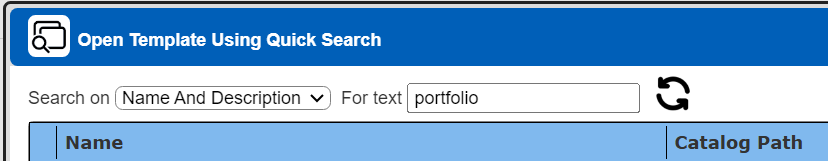
Enter “portfolio” as shown below and then click the right hand retrieve icon.
Choose the row shown below.
 Click
Click

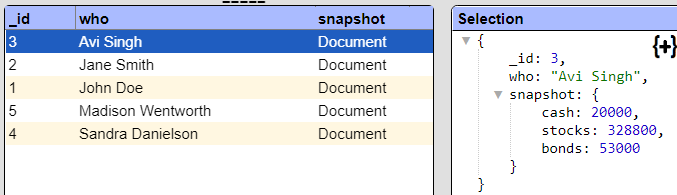
Once loaded, click on the highlighted button to run the retrieval.

Sample results are shown below.
Analysis Template
An analysis template defines how to traverse and format retrieved data. Open a Template Designer from any tool as shown below.(You can press the control key prior to the menu selection to have a new tab open).

. . .

Click the highlighted button.
Enter “portfolio” as shown below and then click the right hand retrieve icon.
Choose the row shown below.

Click
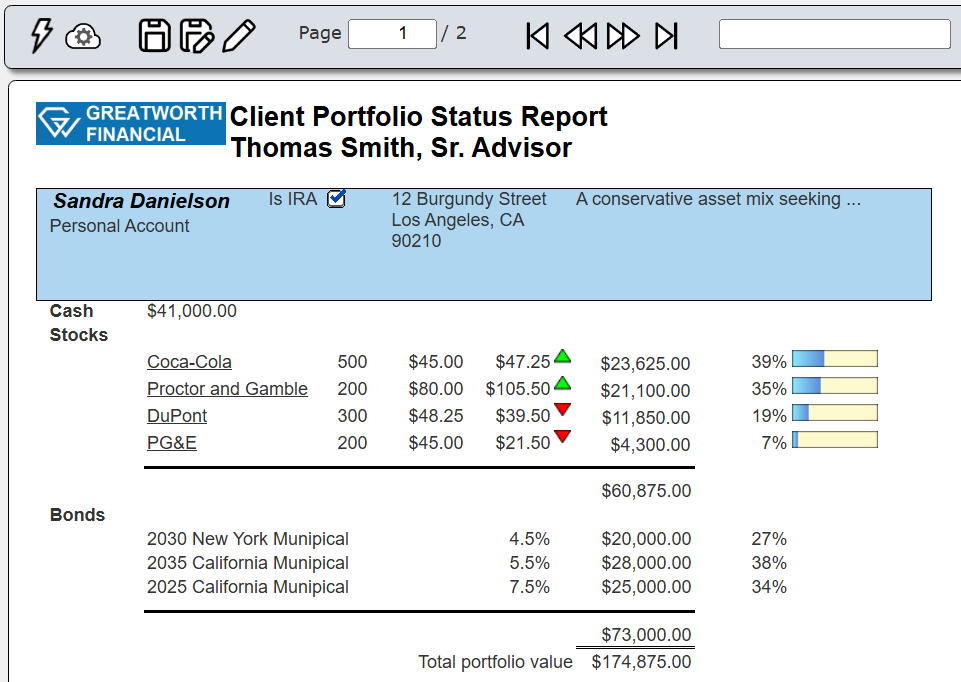
Once loaded, click on the highlighted button to run the retrieval.

Sample results are shown below.
Templates can reference a Data Source by name. This enables multiple templates to reference the same data source and have each template perform different analysis and presentation.
Modern Data Tools and their Interactions
Ad hoc Querying
The Data Source Designer is used to run free form interactive queries. After selecting a Data Service and a database, you simply enter a query and click the Run icon. The resulting list is shown in a table and you can drill into each JSON element to see its details. These data retrieval specifications can then be saved in the Qarbine Catalog s Data Sources to share and to be discovered by others. The queries can be run from within Qarbine or copied into your other tools. The catalog is a convenient way to share queries and knowledge across team members 24x7.
See the Ad Hoc Querying document tutorial walkthrough steps.
Fill-in-the-blank Querying Analysis
Qarbine provides 2 fill-in-the-blank tools. Data criteria wise they are very similar. The difference is that Query by Example (QBE) shows results in a tabular manner like the Data Source Designer, while Report by Example (RBE) provides for data grouping, headers, fonts, formulas, and many other formatting options. As with other Qarbine components, these components can be shared in the catalog as well.
See the Query by Example document for the walkthrough steps.
Analyzing and Reporting on your Modern Data
Overview
Many reporting requirements go beyond simply listing data tabular fashion. If only that is necessary, then use the Data Source Designer or Query by Example tools. With Qarbine you typically author data source components and then reference them by name from multiple reporting templates. This enables the query component reuse and avoids query sprawl nightmares.
Sample Analysis Template
The Template Designer combines the formula power of Excel, with Word formatting features, and PowerPoint layout interactions. The template defines how the incoming data is traversed, processed, and presented. The underlying analysis engine is built to support the dynamic JSON structures found in modern data applications.
You set the template’s main data retrieval which returns a list of objects. The template indicates how to loop through those objects. If an object has an embedded array then the template will have a “group” which specifies how to iterate through that inner data. While this iteration is occurring, your cell formulas are being evaluated and result values are being formatted.
See the Sample Reporting Template document for the walkthrough steps.
Increasing Flexibility via Prompts
Overview
Prompts are one way to provide runtime values to the execution pipeline. Applications can also pass runtime values to Qarbine when it is used in an embedded fashion. We’re going to add some flexibility to our data source query and analysis by prompting for a movie year.
See the Prompt Designer document for the walkthrough steps.
Updating the Data Source for a Prompt Variable
With the prompt you can then go back to the Data Source and use that variable value within the originally hard coded query.
See the Updating Data Sources document for the walkthrough steps.
Updating the Template
Prompts can be associated with both Data Sources and Templates. Load the template, update it if necessary (it is not) and run it.
See the Updating Data Sources document for the walkthrough steps.
Embedded Analytics
Overview
Qarbine can be embedded into custom applications using the Qarbine SDK. Your application can run Qarbine components and pass values for their execution. Likewise you can define templates with interactive results which can call back into your application and perform other actions. See the Embedded Analytics document for the walkthrough steps and various ways to leverage the integration across your applications and modern data resources.
Exporting Your Work
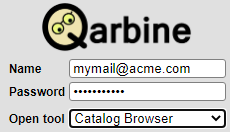
Prior to your sandbox trial period expiring you should export your work to back it up. This is best done from the Catalog tool. This can be accessed from the sign on page using the dropdown as shown below.
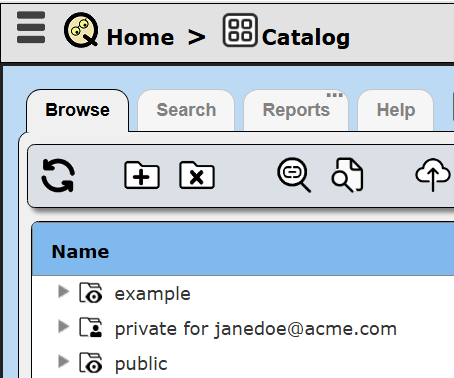
Alternatively, it can be accessed using the upper left hamburger menu as shown below.

. . .

Once opened, navigate to your private folder and select it.
The right hand side shows the various options including the snippet shown below.
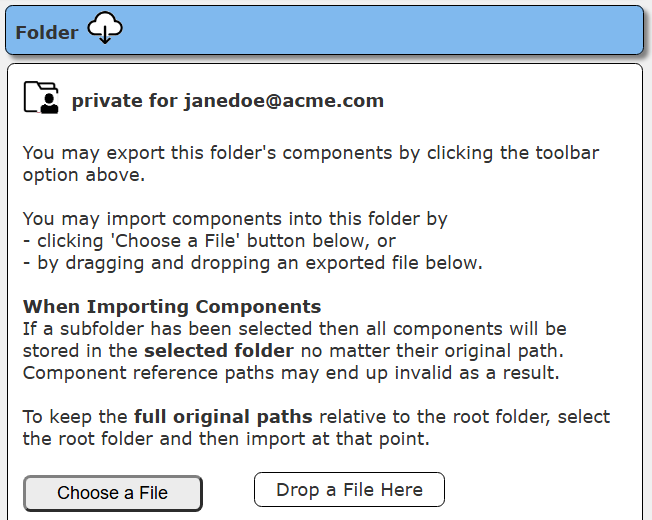
Click the  .
.
The following dialog appears.
Click

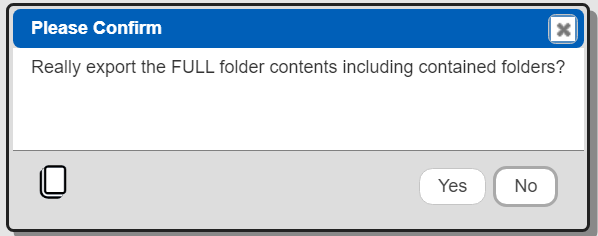
A confirmation dialog appears.
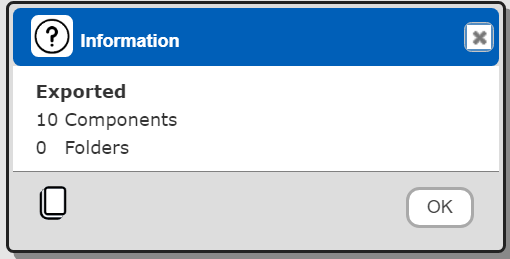
Click

The folder contents will be exported into a JSON file. This is useful for backing up folders. You can later import the folder into another installation.